Data as Infrastructure: How Cranbrook is Building Smarter Economic Decisions
Did you know Cranbrook has a data portal?
For decades, communities relied on static reports, lagging indicators, delayed releases, and snapshots that were often outdated the moment they were published. It worked, but only to a point. Decisions were being made with incomplete timelines and limited transparency.
That’s no longer the case.
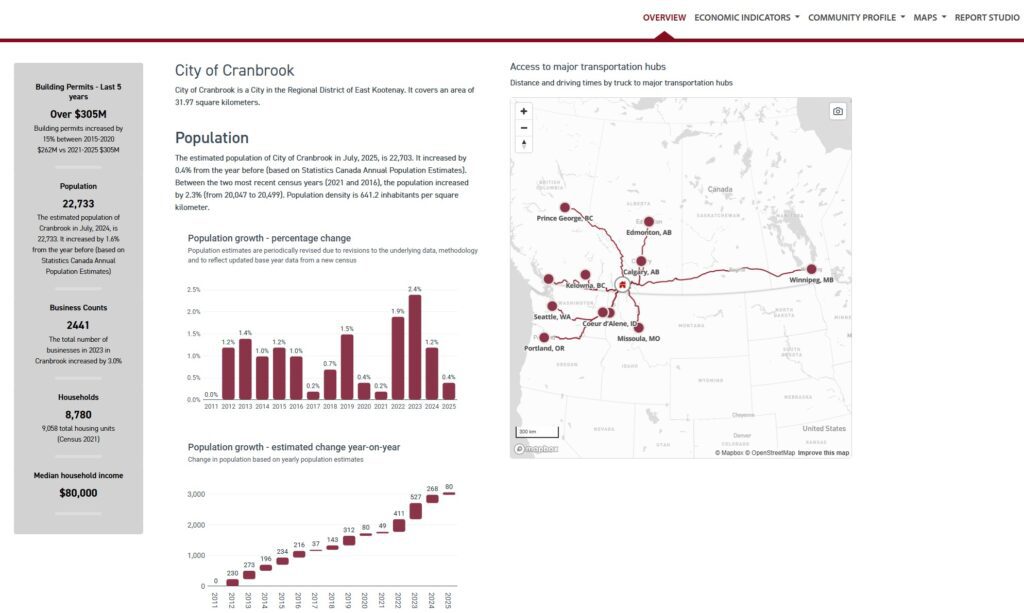
The Choose Cranbrook Data Portal treats data as infrastructure: something that is continuously updated, accessible, and built to support real decisions in real time. Instead of waiting months for reporting cycles, key indicators are now available as they change.
Take building permits. Rather than relying on quarterly or annual summaries, Cranbrook tracks activity in real time. This reduces lag, improves transparency, and allows both the public and decision-makers to see development activity as it happens, not after the fact. It changes the conversation from “what happened” to “what’s happening.”
The same approach extends across the platform.
The portal brings together retail spending analysis, real estate trends, workforce data, and economic dependency metrics into a single, integrated system. It also includes story maps and curated datasets from both free and paid sources, creating a comprehensive view of the local economy. Instead of fragmented data points spread across reports and agencies, everything is organized, visualized, and easy to interpret.
And that matters.
Because when the data is clear, the conversation changes. Discussions move away from assumptions and toward evidence. Investment conversations become more grounded. Policy decisions become more precise. The narrative shifts from general perception to measurable reality, focused specifically on Cranbrook.
This approach has not gone unnoticed. The data portal has been recognized as a leading example in the economic development space and is viewed as a thought leader by organizations such as BCEDA and EDAC. It reflects a broader shift in how communities compete, not just on assets, but on clarity, transparency, and the ability to demonstrate opportunity with confidence.
In many ways, this is about how we communicate.
Early humans told stories with drawings on cave walls: visual, immediate, and grounded in what they could observe. Thousands of years later, the goal is the same, but the tools have changed. In 2026, we are still telling stories, but now we do it with data, maps, and real-time insight.
The Choose Cranbrook Data Portal is that evolution.
It doesn’t just report information. It explains it, connects it, and makes it usable.
If you haven’t explored it yet, take a look. The maps, charts, and visualizations are built to be intuitive and accessible, and they tell a story about Cranbrook that static reports simply can’t.
The data is there. The question is what you see when you explore it.